We Are Your Stock
Market Timing
Road Map
Since 2000, we have provided Daily Proprietary Analysis for 2,200 leading North American Stocks, ETFs, and Indices to help keep you on the Right Side of every Major Market Move.
Join TheUpTrend.com today! Discover market trends, set precise price targets, and trade with confidence. Click Here To Start your 21 day free trial today.
Learn How to Time The Stock Market
Investing in the stock market can be a daunting task, with constant fluctuations and uncertainties that can make even the most seasoned investor feel overwhelmed. However, with our Stock Market Timing Service, investors can make informed decisions with greater confidence. Our proprietary charts and data-driven insights can help predict market trends and identify opportunities for maximum returns. Whether you are a novice or an experienced investor, our service provides the information and guidance you need to succeed in the stock market. With our expertise, you can minimize risk and maximize your investment potential, allowing you to achieve your financial goals and secure a brighter future. So why wait? Sign up for a Free Trial of our Stock Market Timing service today and start your journey towards financial success!

DOW, NASDQ, S&P 500, TSX
We provide daily coverage on the leading stocks, indexes and ETFs.
Analytical, Systematic, Emotion Free.
We don't follow the news or react to rumors or hearsay, we just Follow The Money.


We’ve Got You Covered
No matter weither you’re a Short Term Trader or a Long Term Investor we have you covered with Daily, Weekly and Monthly Charts.

Global Reach
Since 2000 we have been helping investors in 43 countries.
What Do We do?
Welcome to the world of TheUpTrend!
If you’re looking for a way to make informed and data-driven investing decisions, then you’ve come to the right place. TheUpTrend is a powerful set of easy-to-use and understandable tools that can help you improve your investing results. Here are just a few reasons why you should consider using TheUpTrend in your investing strategy:
TheUpTrend can help you identify trends:
TheUpTrend can help you identify key
support and resistance levels, or as we call them, Price Targets. These levels can provide valuable information on where to enter and exit a trade. They can also help take profits as a trend develops and before it ends.
TheUpTrend can help you identify patterns:
By analyzing chart patterns, you can identify potential breakouts or reversals in the market. This can help you make trades that have a higher probability of success while reducing your risk.
TheUpTrend can help you manage risk:
By using our tools such as the Panic Zones, Pressure Zones, and our Flypaper Channel Charts, you can better understand market volatility and adjust your risk management strategy accordingly.
TheUpTrend can help you make informed
investing decisions: By combining TheUpTrend charts with fundamental analysis, you can get a more complete picture of the market and make your investment decisions more informed.
In summary, TheUpTrend is a powerful set of easy-to-use tools that can help you better understand the markets and make better investing decisions. By using TheUpTrend, you can identify trends, know when and where to Buy and Sell and identify key support and resistance levels to help you manage risk better. Whether you’re a beginner or an experienced investor, incorporating TheUpTrend into your investing strategy can help you achieve your investing goals while saving you time and dramatically reducing your stress. It takes less than 5 minutes a day if you’re an active trader, or 5 minutes a week if you’re a longer-term investor. So what are you waiting for? Start your Free Trial to TheUpTrend today and take your investing to the next level!

Stephen Whiteside – Founder & Head Chart Guy
Panic Zones
The Right Side
Smart Money
Price Targets
Could These Charts Help You Become a Better Investor?
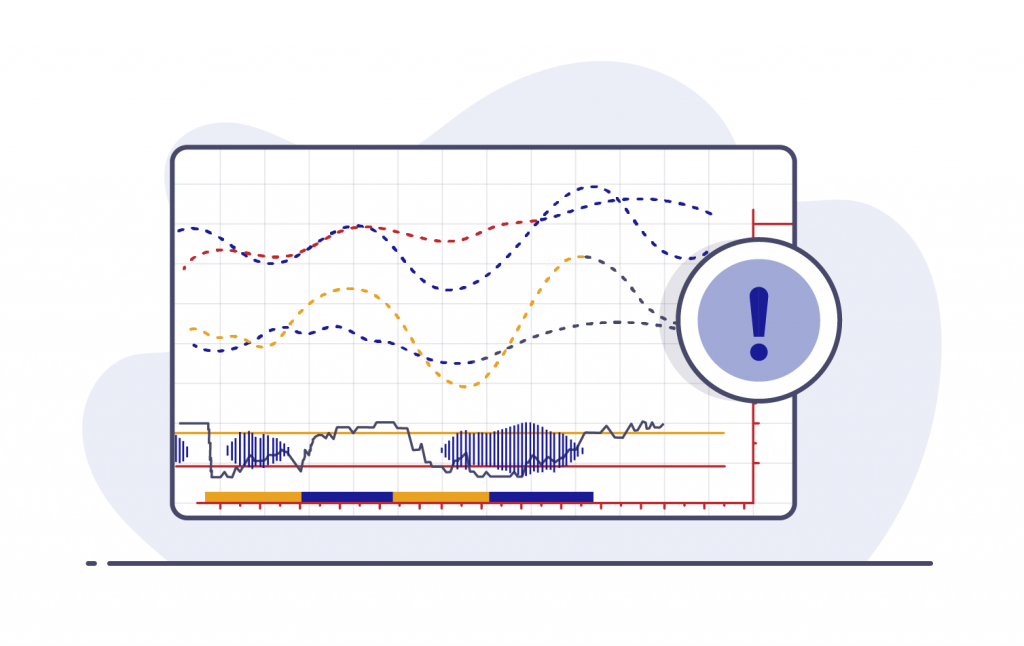
Panic Zones
Market trends often end as investors become extremely bullish or extremely bearish. We track this activity using our Panic Zone Charts. Using our Panic Zone charts we can look for Low-Risk Buying Opportunities off the bottom of the Panic Zones and Low-Risk Selling Opportunities off the top of the Panic Zones.
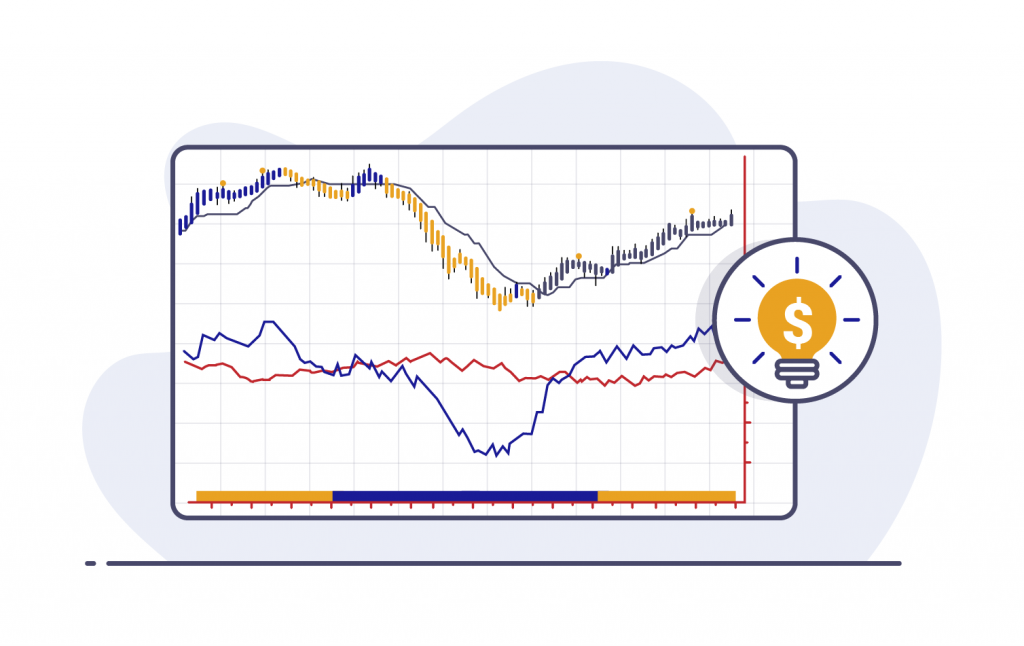
Smart Money
Do you know who is controlling the price movement of your stock? Is it the Institutional investors or the public? If you want to succeed in the stock market, you need to follow the Institutional investors (The Pros). Using this chart we keep track of the impact of The Pros vs. The Public. Who would you rather follow?
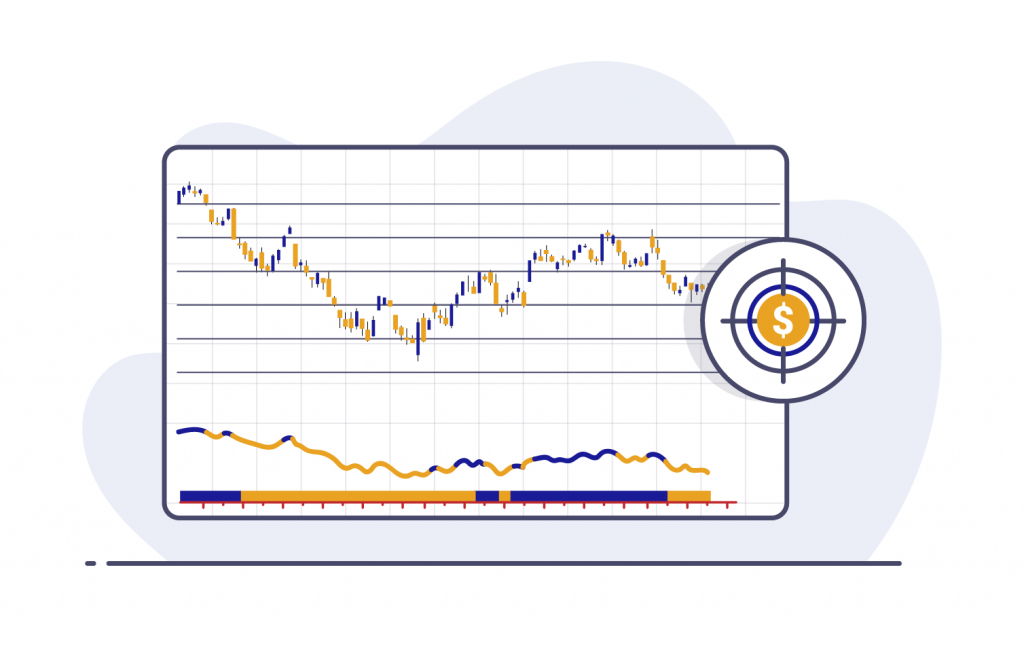
Price Targets
Over time, each stock will start to trade in a predictable manner in which we can predict future price movement based on previous price action. Typically a stock will move one or two price targets at a time. This is known as a measured move. Depending on market conditions, our price targets are good for months and sometimes even years.
Weekly Price Targets
In this weekly Price Target example, if Alimentation Couche-Tard starts to break out above $62.50 on a weekly basis, then the next price targets would be $68.75 and then $75. And if this stock starts to fall, we would look for potential areas of support to be at $56.25 and then if that breaks then we would look to move down to $50.

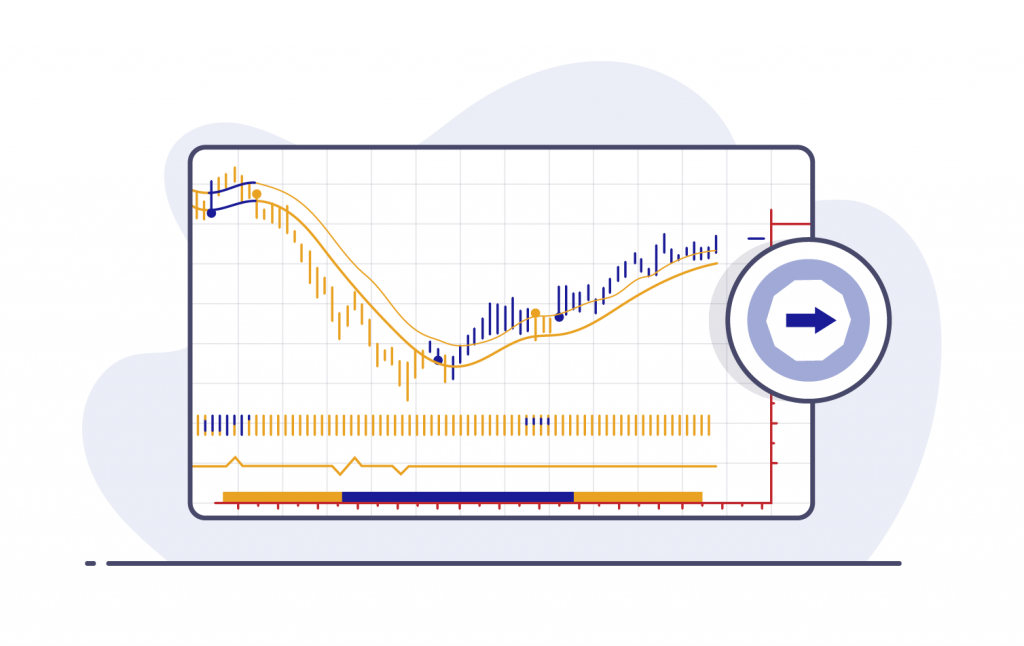
Daily Flypaper Channel
As stocks move from a bull market to a bear market, or from a bear market to a bull market, they often enter a neutral zone, We call this area the Flypaper Channel because stocks often get stuck in the channel. In a bull market, this channel should act as major support, in a bear market this channel often acts as a major area of resistance.
Here’s a stock currently in a bull market using the Flypaper Channel as support. Investors continue to buy the dips. A breakdown below the Flypaper Channel would indicate that a lot of long-term investors have walked away from this stock.
Weekly Flypaper Channel
Looking at a stock currently in a bear market, you can see the Flypaper Channel acting as resistance as investors continue to use it as an area to sell any up moves. A breakout above the Flypaper Channel would indicate a major shift in investor sentiment regarding this particular stock.
Daily Mid Term
The Midterm chart is designed for investors who want to keep on the Right Side of any major market move while giving the market a little more breathing room. We publish this chart in both daily and weekly versions.
Weekly Midterm
Daily Right Side
if you’re an active investor/trader or want to keep a tight grip on your long-term investments, the Right Side chart is the chart for you. This chart is much more active than our Midterm chart and is featured daily in our Pre Market Videos.
As with all of our charts, blue equals bullish while red equals bearish.
The system is very simple; we buy on the first close above the upper channel line and sell on the first close below the lower channel line. Anything trading in the channel is considered neutral.
Here’s an example of our Daily Right Side Chart.

Weekly Right Side Chart
Monthly Right Side Chart

Top Reasons why you should be using TheUpTrend today:
- Identifies trends
- Provides entry and exit signals
- Set price targets
- Assists in risk management
- Works in any market
- Incorporates market psychology
- Provides a visual representation of Who Is In Control
- Identifies support and resistance levels
- Complements fundamental analysis
- Provides historical perspective
- Plus! Take Advantage of Stephen's 40+ years of Stock Market Experience
Experience Unmatched Support: Our Support Team Goes Above and Beyond for You!
- To help get you started quickly, we provide online tutorial videos in multiple languages.
- To keep you going, we provide a daily premarket video to help with your short-term trading activities.
- And for longer-term investors we provide a weekly video newsletter Stock Market Timing Television.
- All of our video tutorials are recorded in English and then translated into Arabic, Chinese, French, German, Hindi, Japanese, Korean, and Spanish.
- Yearly membership also includes a 45 minute one-on-one online tutorial.

Are you ready to get started? Start today with our risk-free 21 day free trial.


You can start with a month-to-month membership, or save money by signing up for a yearly membership. And to reward our long-term members, we offer a five-year membership so you can save even more money.
Experience the power of our Stock Market Timing Service for yourself, risk-free. With our 21-day free trial, you’ll gain access to exclusive insights and analysis that can help you make informed investment decisions. Whether you’re a seasoned investor or just getting started, our service can provide you with valuable information to help you achieve your financial goals. Plus, with no obligation to continue after the trial period, you can cancel at any time. You have nothing to lose and everything to gain. Try us today and see why our members trust us to guide their investments.
Latest News
To make analysis easier all of our charts are color-coded, Blue equals bullish while Red equals bearish.
By using our charts you can easily understand the direction of the market and make trades that align with the trend. This can help you avoid making trades against the trend, which can lead to losses.
